—
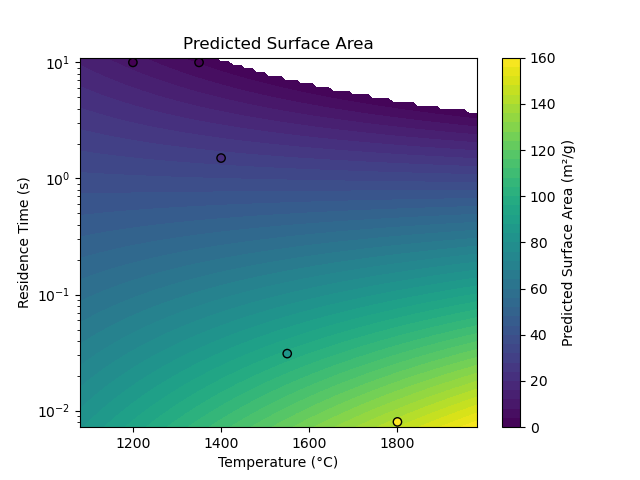
Surface Area Model.#
Plot surface area (in m^2/g) as a function of temperature and residence time, as predicted by
Kirk-Othmer data, using KirkOthmer2004SurfaceArea model.
import matplotlib.pyplot as plt
import numpy as np
from spy.misc.arrays import logspace

from bloc.chem.heat_transfer import KirkOthmer2004SurfaceArea

model = KirkOthmer2004SurfaceArea()

residence_time_data = model.RESIDENCE_TIME_DATA
temperature_data = model.TEMPERATURE_DATA
surface_area_data = model.SURFACE_AREA_DATA

# Remove NaN values from temperature_data
temperature_data_clean = temperature_data[~np.isnan(temperature_data)]

# Create a meshgrid for temperature and residence time with extrapolations
temperature_range = np.linspace(
    temperature_data_clean.min() * 0.9, temperature_data_clean.max() * 1.1, 100
)
residence_time_range = logspace(
    residence_time_data.min() * 0.9, residence_time_data.max() * 1.1, 100
)
temperature_grid, residence_time_grid = np.meshgrid(
    temperature_range, residence_time_range
)

# Predict surface area for the grid
predicted_surface_area_grid = model.predict(
    temperature_grid.ravel(), residence_time_grid.ravel()
).reshape(temperature_grid.shape)

# Keep positive values only
predicted_surface_area_grid[predicted_surface_area_grid < 0] = np.nan

# Plot the predicted surface area
plt.figure()

plt.contourf(
    temperature_grid,
    residence_time_grid,
    predicted_surface_area_grid,
    levels=50,
    cmap="viridis",
)
plt.colorbar(label="Predicted Surface Area (m²/g)")
plt.xlabel("Temperature (°C)")
plt.ylabel("Residence Time (s)")
plt.xscale("linear")
plt.yscale("log")
plt.title("Predicted Surface Area")

# Overlay the data points
# Use normalized color values compatible with typing expectations
colors = surface_area_data - np.nanmin(surface_area_data)
colors = colors / np.nanmax(colors) if np.nanmax(colors) > 0 else colors
plt.scatter(
    temperature_data,
    residence_time_data,
    c=colors.tolist(),
    cmap="viridis",
    edgecolor="k",
)

plt.show()
Total running time of the script: (0 minutes 0.133 seconds)